Data Visualization &
Information Design
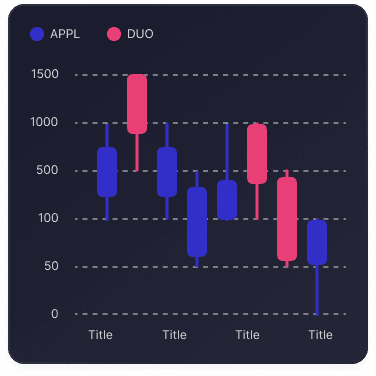
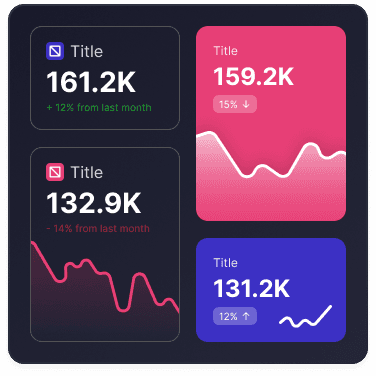
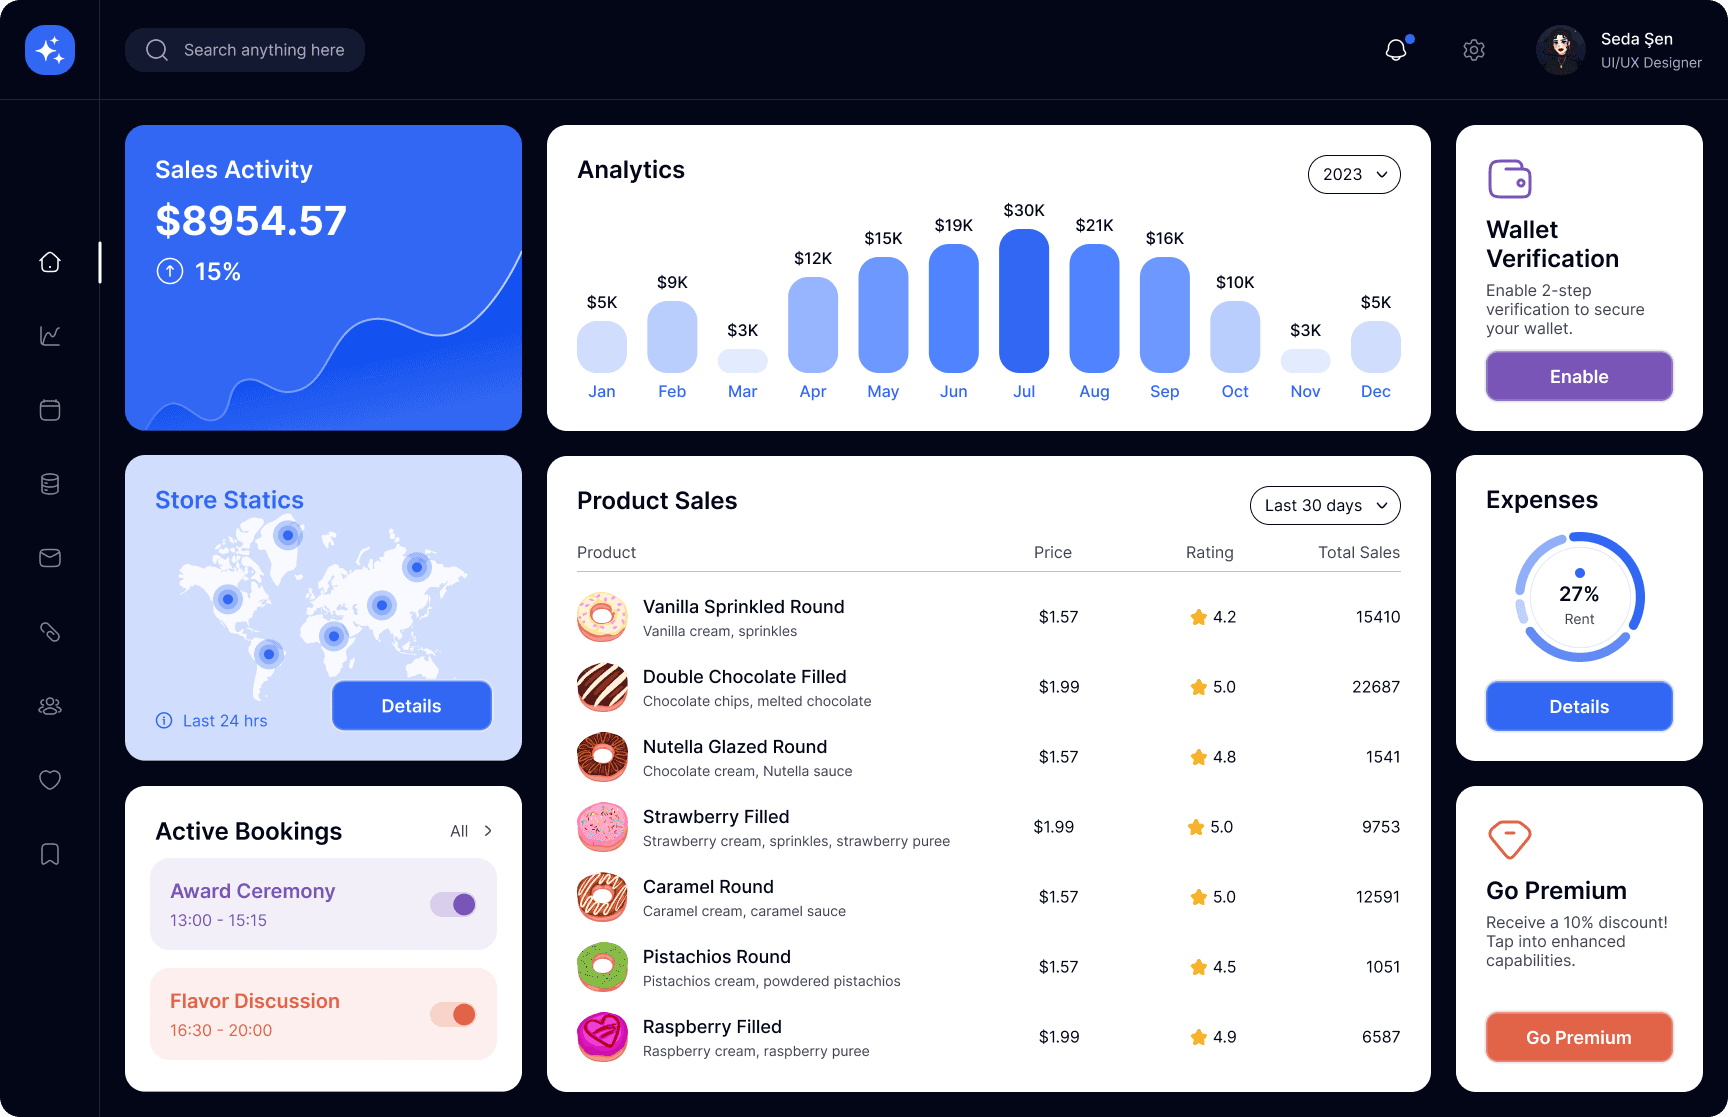
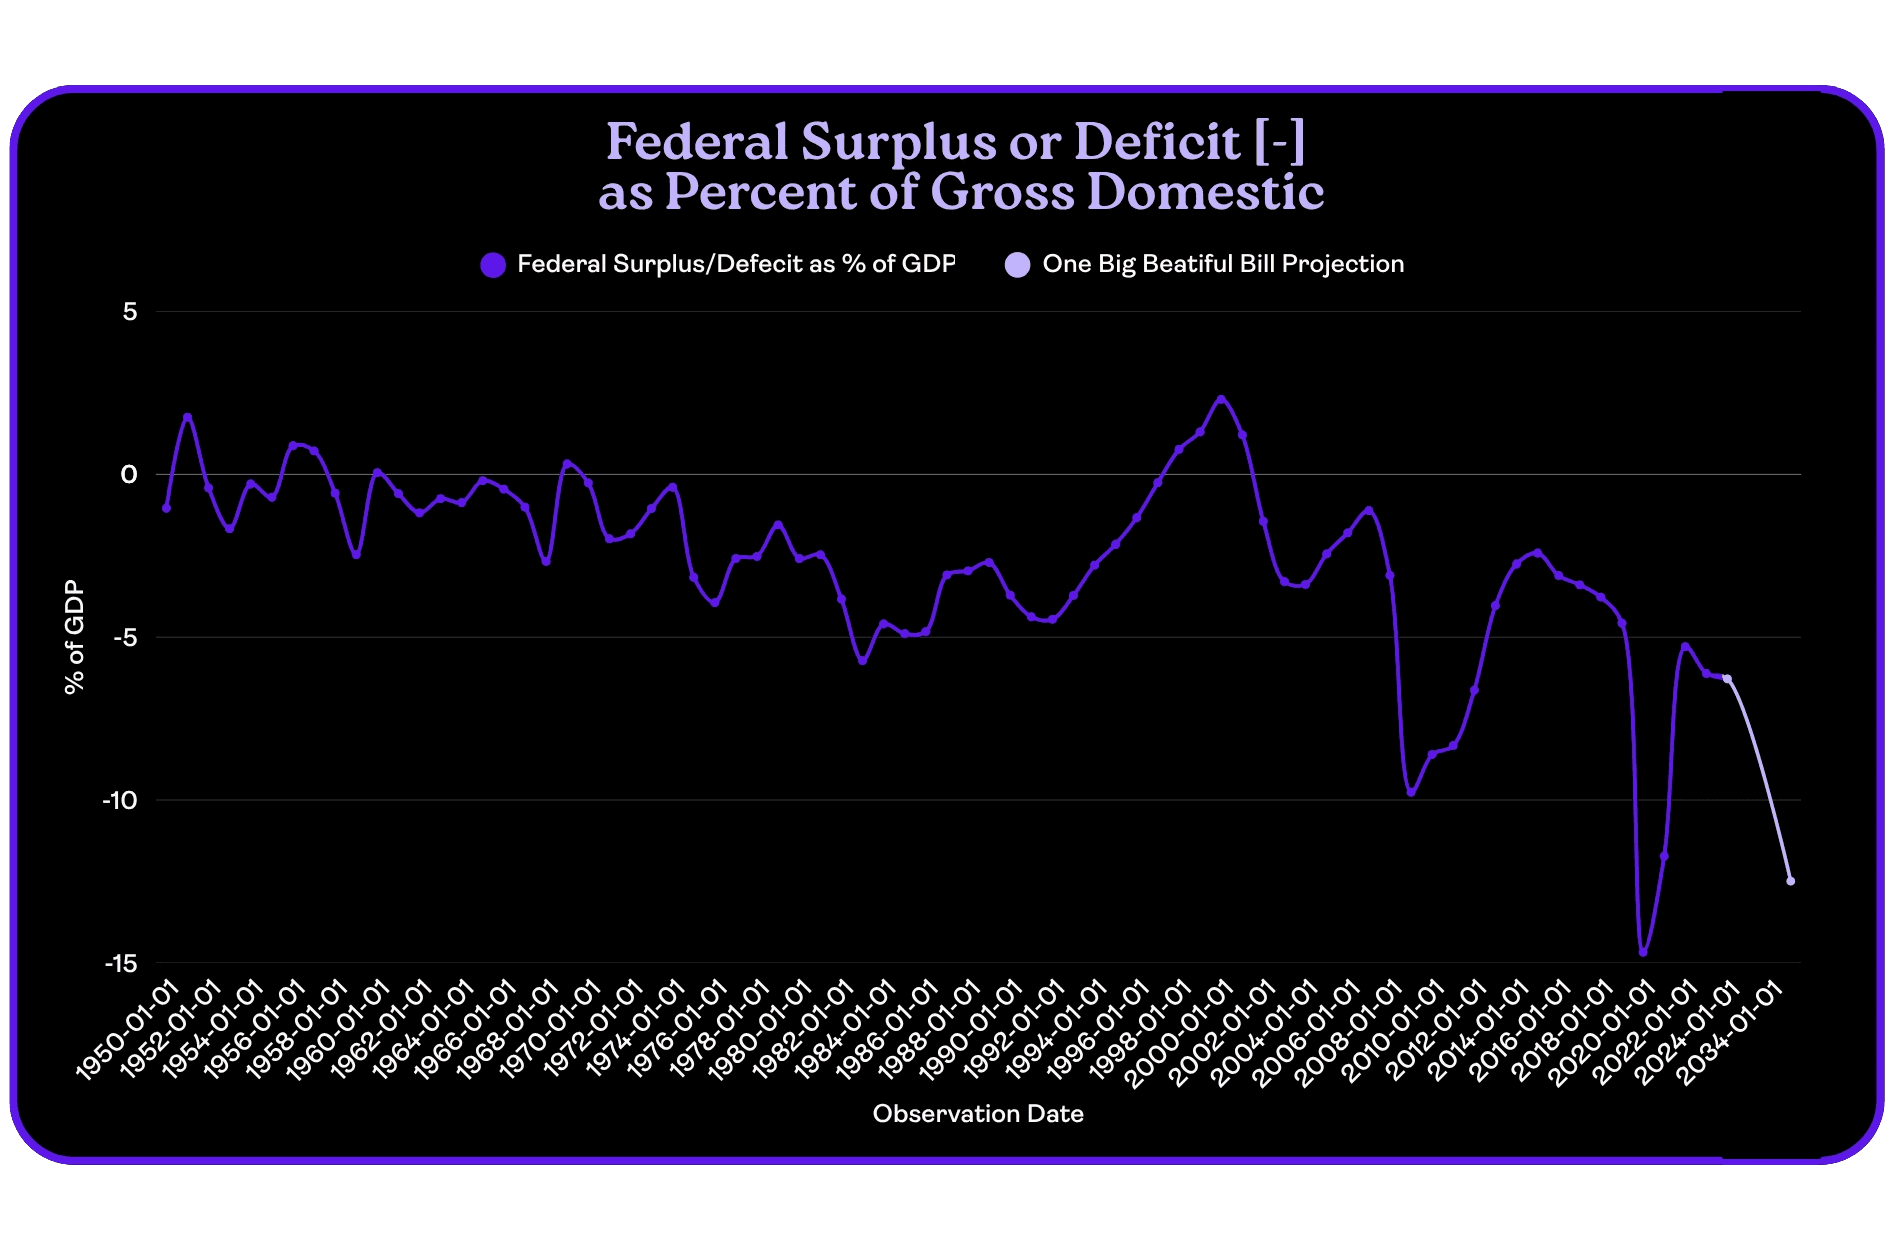
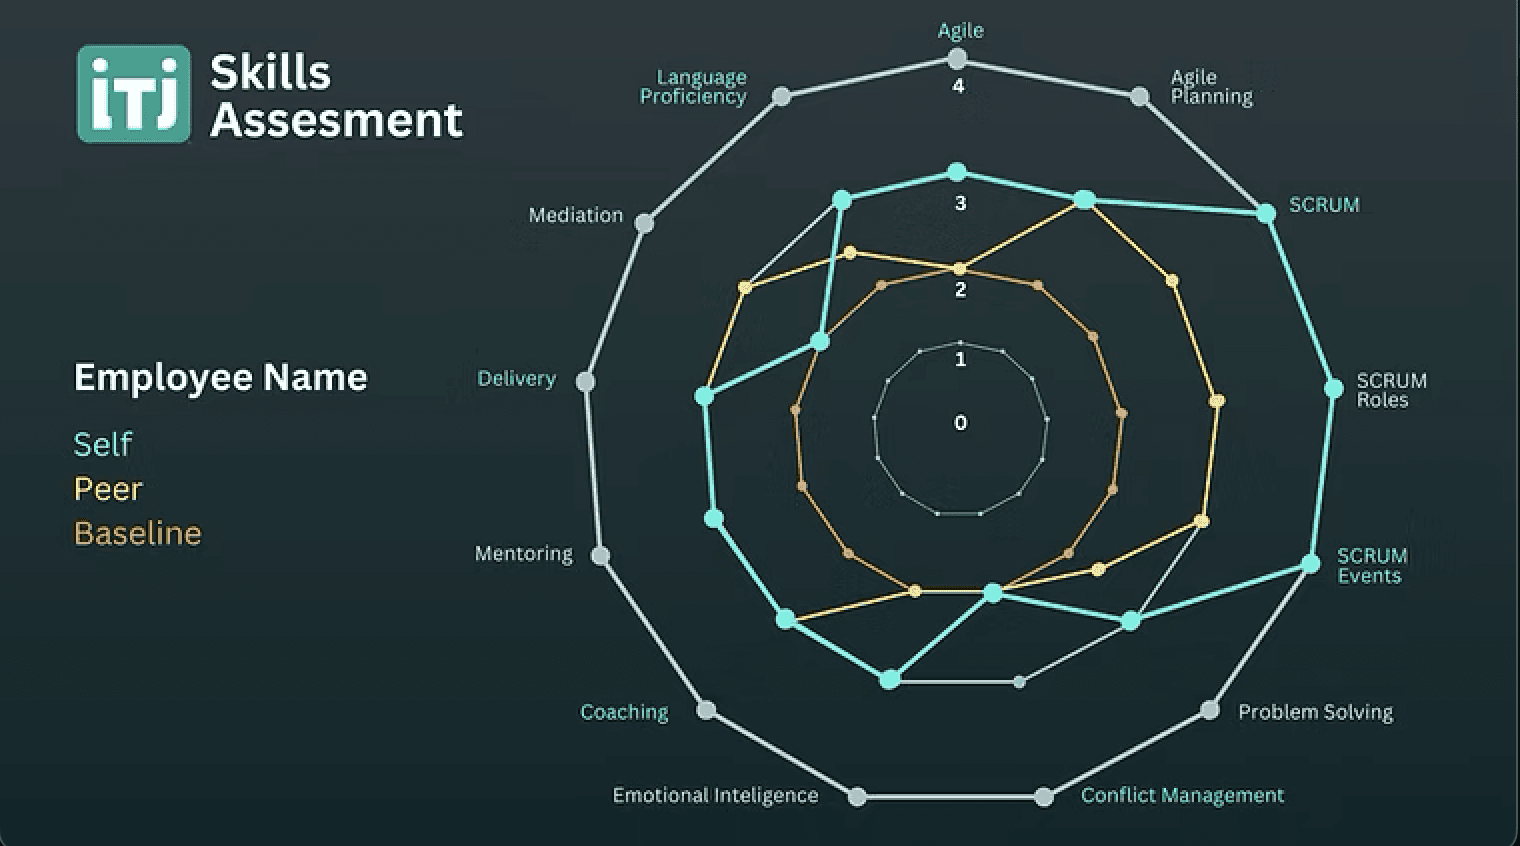
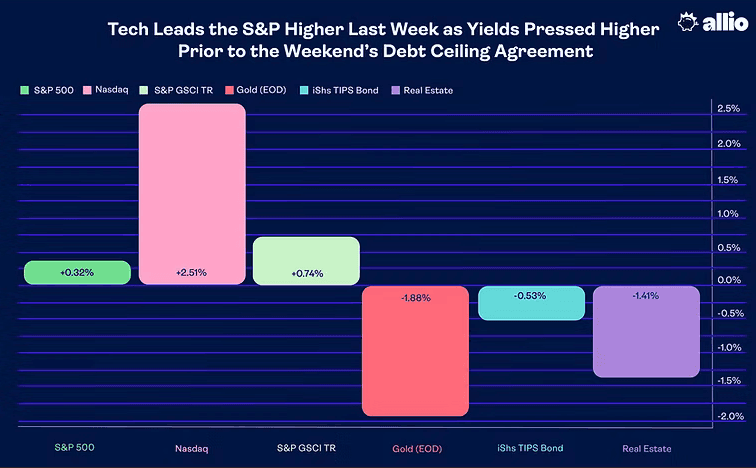
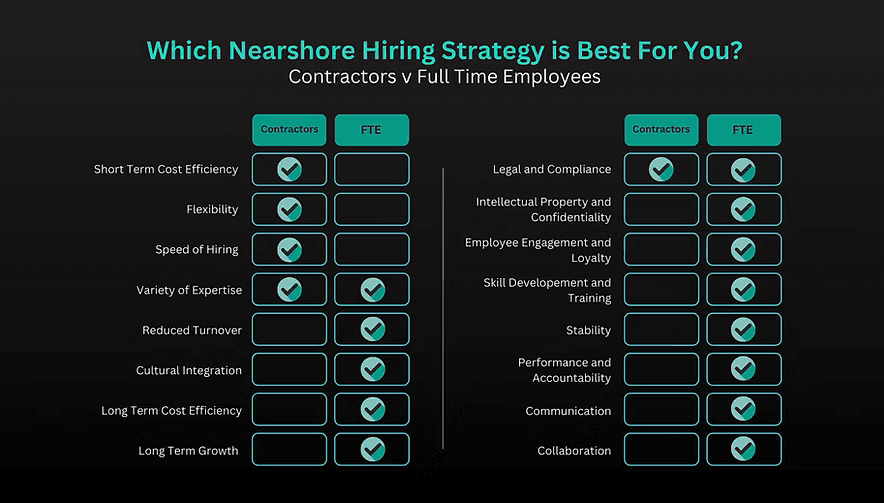
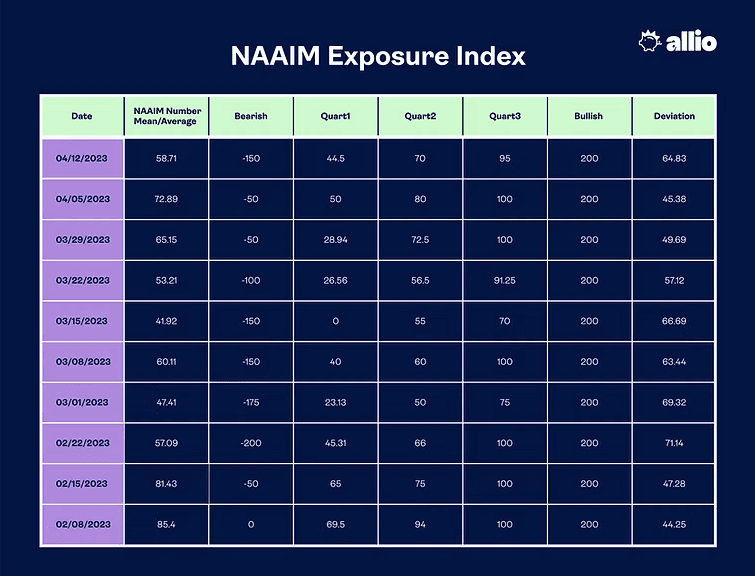
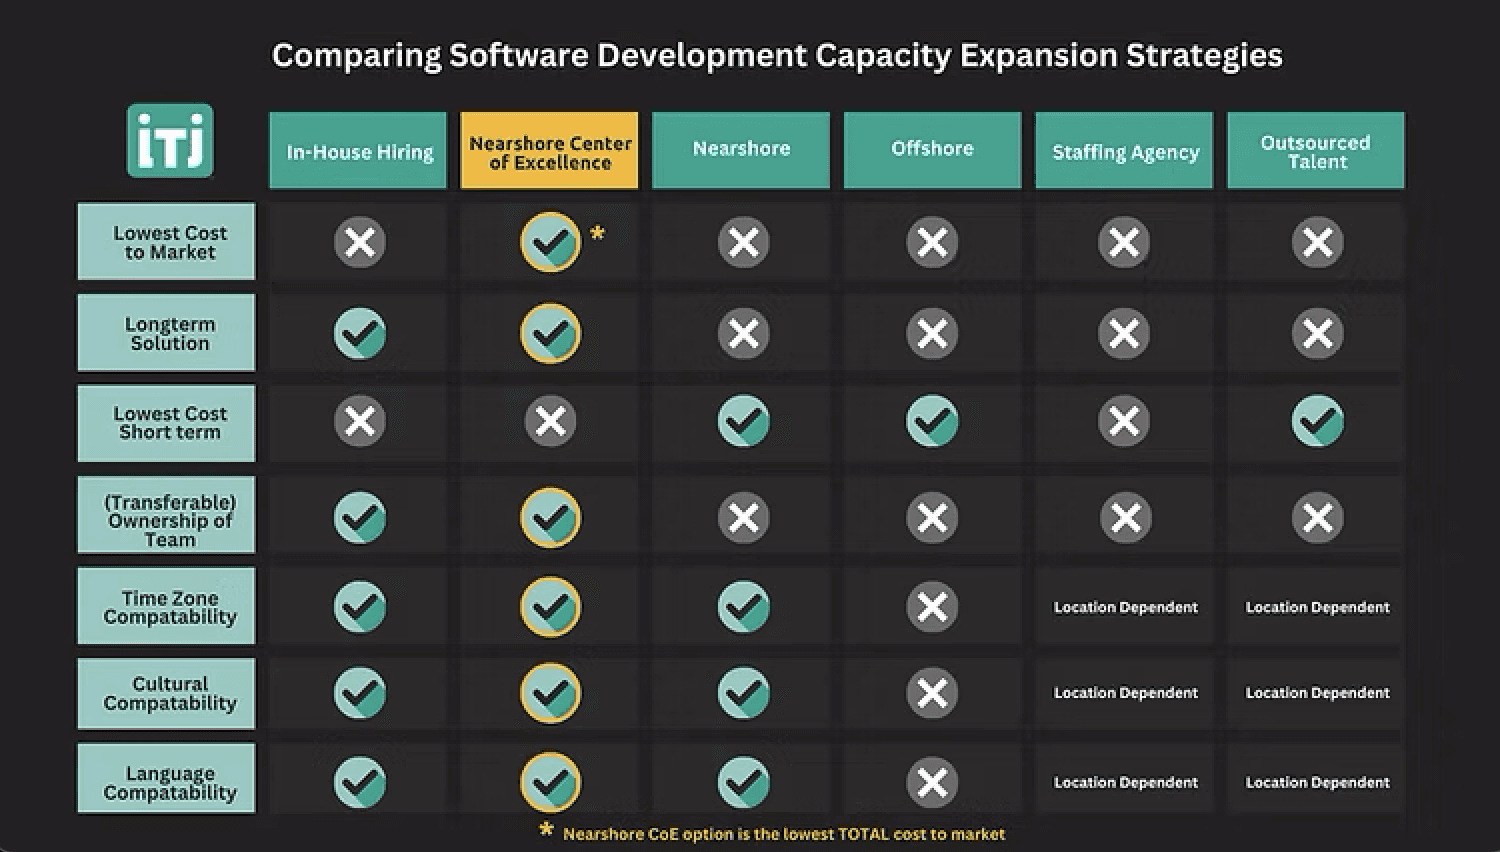
Data design: charts, dashboards, and infographics that read fast. Hierarchy and color carry the point before the numbers do.
Most of this work lives in fintech and housing: Allio market updates, Realm bid comparisons, board reporting. Built in Figma and Illustrator, with AI tools for speed.